Polski
The holiday season is almost upon us. Some of the watermen spent it at the sea, closely monitoring the quality of water in the seaside bathing areas. Some went to exotic countries, to take in the charms of warmer waters and beaches whiter than those on the Baltic. And some visited our beautiful lakes. We have quite a number of them in Poland – more than 7,000, including about 1,000 with an area of more than 50 hectares – and they are popular holiday destinations. And what are these lakes of ours?
Circulating opinions on the subject sometimes vary, from “our beautiful lakes” to “terribly degraded.” It probably depends on the individual’s experience and where the opinionated person ended up. Mostly everyone is looking for the cleanest lakes and such information (more or less reliable) can be found on many portals. This year I also heard a rather perverse question: and which lake in Poland is the dirtiest? Of course, we tried to answer it. And what is the case overall?
Clean or dirty water?
To answer this question, one must first consider what these terms mean. Of course, it all depends on what needs we are evaluating water quality for. Other indicators and/or numerical criteria speak to the suitability of water for drinking, others for industrial use, others for bathing; still others determine its ecological and chemical status.
As it happens, in the public space, clean or dirty water has been most often discussed recently in the context of its condition, an aftermath of the EU’s implementation of the Water Framework Directive. But even focusing only on this aspect of it (water as a habitat for living organisms), the issue is still not simple. The evaluation of water status is carried out on the basis of dozens of indicators, and the final result is determined by the worst one. A lake is only as good as its weakest element. That is, what kind of water will be clean and what kind of water will be dirty? Let’s look at specific data.
What does the data say about the cleanliness of the lakes?
The most up-to-date and complete lake assessment data from state environmental monitoring is available for the period 2016-2021. They can be obtained from the website of the Chief Inspectorate of Environmental Protection. During this period, 861 lakes of more than 50 hectares were surveyed and assessed, and it was not possible to conduct a full-scale assessment for all reservoirs.
Overall, lakes in poor condition account for 99% of those assessed. Scary, isn’t it? But let’s go deeper. Chemical exceedances are shown by 90% of the lakes. In terms of ecological status or potential, 86% do not meet the objectives of the WFD. So is there anywhere else to go on vacation without getting your bathing suits dirty?
Ecological status of the lake, or again about the devil in the details
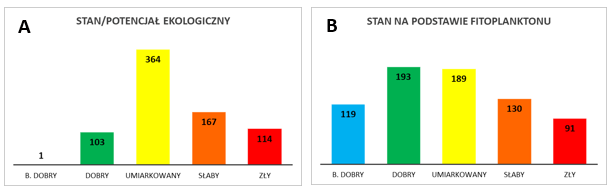
Of course, as always, the devil is in the details, and I caution against jumping to conclusions too hastily. It is worth realizing that of those 89% of lakes that do not meet the criteria for good ecological status, more than half are in moderate condition, and 18% are in poor condition, with the remainder in poor condition. That is, the distribution of occurrences resembles a Gaussian curve with a dominant share of “mediums” (Figure 1A).
Remembering that ecological status consists of an assessment of five biological indicators, one indicator of hydromorphological transformation and several physicochemical indicators, we scrambled on. If one assumes that the most authoritative biological indicator of trophic state is phytoplankton, things get even more interesting, as the distribution peak surprisingly shifts toward good state (Figure 1B), although the proportion of lakes in moderate state is equally large. Believe it, don’t believe it, that’s what the data says.
The lack of full consistency between ecological status and the status of its component indicators is not surprising. Biological assemblies, by definition, are supposed to show differential sensitivity to pressure, and preferably of different types (that’s what five are studied for, not one). In the group of 96 lakes in poor ecological status/potential, where more than one biological element was examined and assessed, I could not find a single one that had all of them in the worst class. Usually it was a combination of bad, weak and moderate condition, but all combinations happened. The worst ratings were achieved by Kunickie Lake in Legnica County (Lower Silesia Province) with poor condition of phytoplankton, macrophytes and benthic macroinvertebrates, and only phytobenthos was characterized by poor condition (fish were not examined). On the opposite side of the scale are lakes Krępsko Długie or Wierzchucińskie Małe, where all biological elements are in the first or second class, and the poor condition is due only to the fifth class of ichthyofauna (why this is so, probably only ichthyologists could explain). In general, there are at least a dozen lakes in which ecological status below good is determined by a single element.
An analogous analysis performed for the least degraded lakes (at least good with at least two biological elements assessed, and there were 89 of them) showed that only five had all biological elements in very good condition(Malcz Północny, Budzisławskie, Płaskie, Kirsajty and Kownatki). In the others, at least one was in good condition, which automatically (according to the “worst decides” rule) reduces the grade to good. This largely explains the negligible number of lakes in very good condition, especially considering that supporting indicators (hydromorphological and physicochemical) also have the power to lower ecological status.
Life-giving and treacherous biogenes
I suspect that for most water users, the phrase “ecological status” doesn’t say much, and it’s not clear to everyone what’s underneath it. Because what does “phytoplankton-based status” mean? Intuition tells us that it is all about low biomass and lack of blooms, but already the nuances of the indicator require some competence in interpretation. So let’s try an analysis of indicators more intuitively appealing to the imagination.
An important piece of information that tells us about the trophicity of waters is the abundance of nutrients, primarily phosphorus and nitrogen compounds. Especially since the biggest problem of lakes in Poland is excessive eutrophication.
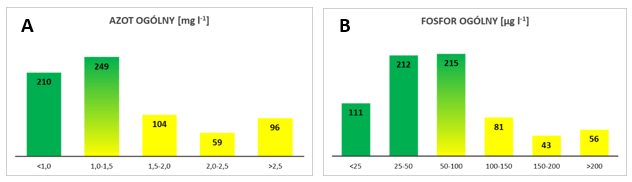
For different types of lakes, the criteria vary (ecosystems with different natural conditions have different requirements), but adopting the most liberal ones from the current classification regulation [1], namely. 0.08 mg l-1 for total phosphorus and 1.5 mg l-1 for total nitrogen, exceedances of these values occurred in 29% and 26% of the assessed lakes, respectively. Quite a bit, although I expected a larger share. Of course, taking the sharpest values, i.e. 0.025 mg TP l-1 and 1.10 mg TN l-1, will be 68% and 49%, respectively, but here we already put requirements typical of mesotrophic lobelia lakes. Again, most lakes are in the “medium” group, with nutrient concentrations in the ranges of values close to the limits for good status (Figures 2A and 2B).
Interestingly, the record-holder in terms of the value of average annual total phosphorus concentration (>1 mg TP l-1), East Weneckie Lake located in the Kujawsko-Pomorskie Voivodeship in the Gniezno Lake District, is in poor ecological condition, but at the same time has a good status of ichthyofauna and phytobenthos. In addition, it is one of the few in Poland with no chemical exceedances (which will be discussed in a moment). The lake with the highest concentration of total nitrogen, Jansko in the province. Lubuskie, west of Zielona Gora (7.2 mg TN l-1, almost five times the standard) also has a poor status and a wide variation in the assessment of biological elements, from poor to very good (phytobenthos). As you can see, nutrients are important, but not necessarily unambiguously authoritative in determining the degree of degradation of an ecosystem.
Universal indicator – water clarity
One of the most universal and authoritative characteristics of water is its clarity. This indicator is also quite intuitive and well defines what one might call “organoleptic purity” (a very apt term, unfortunately not mine). It is also often cited in the context of the best swimming or diving attraction sites.
Water clarity is a product of many parameters – it is directly affected by the amount of suspended matter (so-called seston), both inorganic (mineral particles and organic matter debris) and organic (zoo- and phytoplankton). The amount of the latter depends on, among other things. From nutrient abundance. Water clarity is most often measured with a Secchi disk, which is a metal disk lowered into the water on a graduated line. The depth at which its disappearance is observed determines the transparency of the water and is called the “visibility of the Secchi disk.”
The clearest lakes in Poland reach a clarity of 6-7 meters in the season, and more can happen! In June of this year, social media circulated the news that a record 10.38 meters of Secchi disc visibility was recorded in Lake Powidzkie on June 7, and the lake was hailed as “the cleanest lake in Poland” from the march. This is indeed an impressive result for the conditions of the Polish Lowlands, but I would not overdo it to award the laurel of the winner so hastily.
Perceptions of lake quality based on instantaneous measurements may not fully correspond to the results of monitoring studies. Remember that environmental standards for assessing the condition of lakes are based on seasonal averages (derived from at least four measurements between March and October). Powidz Lake is definitely a beautiful ecosystem with good condition of biological assemblages and water corresponding to mesotrophy, but the average seasonal water transparency there in the analyzed period was 4.76 m (data from 2021; how much would be in the current year, it is difficult to say, since the results of current measurements are not yet available). Much better than Powidzkie were Ostrowite and Białe Wigierskie lakes with an average disc visibility of 7.55 and 6.40 m, respectively, as well as Ińsko, Budzisławskie and Białe Filipowskie lakes (water transparency in the range of 5.5-6.0 m).
Disk visibility is an indicator that is also particularly useful and intuitive for identifying the dirtiest ecosystems. If the clarity is 0.5 meters or less then, figuratively speaking, standing in water up to our knees, we can hardly see our feet. And there were 55 such lakes in Poland during the analyzed period. And in fact, there’s no getting around it, they were all in poor or bad ecological condition, with exceedances of many indicators and significantly degraded biological communities. The shallowest transparency was in the shallowest lakes Jańsko and Kosowickie (<0.3 m, and we are talking not about the instantaneous measurement, but the seasonal average value!). I advise against vacationing there!
And the salinity?
Unlike rivers, lakes in our country do not have as much of a salinity problem. Conductivity values in 90% of them do not exceed 620 µS cm-1. The exception is the coastal lakes, where the increased salinity is due to natural conditions (the influence of Baltic waters). Only in two non-Permian lakes, Wolickie and Mielno, does the specific electrolytic conductivity exceed 1000 µS cm-1. Both lakes are located on the course of the Notec River, and their very high average annual conductivity (2585 and 1708 µS cm-1, respectively) is due to pollution of this river by chemical industry plants located in the catchment area.
What about the chemical status?
The analysis of chemical status is interesting. Let me remind you that it is a separate element of assessment from ecological status/potential, involving the testing of more than 50 chemicals considered hazardous to the aquatic environment.
As indicated earlier, 90% of the lakes assessed in 2016-2021 do not meet the criteria for good chemical status, and no exceedances were found in only 72 out of 712 assessed reservoirs. In half of the lakes, the poor chemical status was due to exceeded permissible levels of one or two substances, and in almost all cases these were brominated diphenylethers (pBDE) determined in fish tissues (the good status limit is set at a level that is exceeded today in fish tissues in many countries). Other substances that are the main cause of the poor chemical condition of our waters are mainly benzo(a)pyrene, mercury and heptachlor.
The record holder in terms of poor chemical status is Lake Bytnickie located k. Bytnica in the province. Lubuskie, which shows exceedances of as many as nine indicators, including lead, PAHs, heptachlor, fluoranthene, perfluorooctanesulfonic acid or brominated diphenylethers. At the same time, it is a severely degraded lake in terms of nature, in poor ecological condition and with highly zeutrophic water. Perhaps they could be called the dirtiest in Poland. Or at least one of the dirtiest (of those that were studied and evaluated). In another 25 water bodies, exceedances of 5-6 indicators were recorded. Interestingly, among them are lakes, such as Bierzwnik, Ińsko, Strzeszyno and Zdbiczno, in good ecological condition, where all aquatic organism communities are in very good or good condition, and water quality parameters indicate mesotrophy. Beautiful lakes, but unfortunately rated as bad due to their chemical status.
So where to go to the lake?
Analyzing the maps of the distribution of lakes with different ecological status/potential and chemical status in the Lake District, which are available on the GIOŚ website, it seems that justice prevails and everything is everywhere. In truth, it seems that more lakes with exceedances of the indicators can be found in the Greater Poland Lake District (especially in its part covering the Gniezno and Lubuskie Lake Districts), and relatively the least in the Drawskie Lake District and Suwałki Lake District, but in fact in most lake districts the mass of medium lakes (i.e., with waters of such and such, neither good nor bad, which can be called moderate) dominates, among which we can find both those very heavily degraded and gems of excellent quality.
The water’s suitability for bathing (determined mainly by sanitary parameters in the littoral zone) and its ecological or chemical status (assessed on the basis of a number of indicators tested throughout the lake basin, mainly in the deep water, several times during the season) are largely different issues. However, there is a high probability that ecosystems in good condition will also please our senses as recreation sites. When considering the choice of a lake for a holiday getaway, let’s look not only at the GIS bathing service, but also at the website of the Chief Inspectorate of Environmental Protection, where we can find plenty of intriguing information about the condition of our waters.
Source:
[1] OJ. 2021 item. 1475. Decree of the Minister of Infrastructure dated June 25, 2021. On the classification of ecological status, ecological potential and chemical status and the method of classifying the status of surface water bodies, as well as environmental quality standards for priority substances