Polski
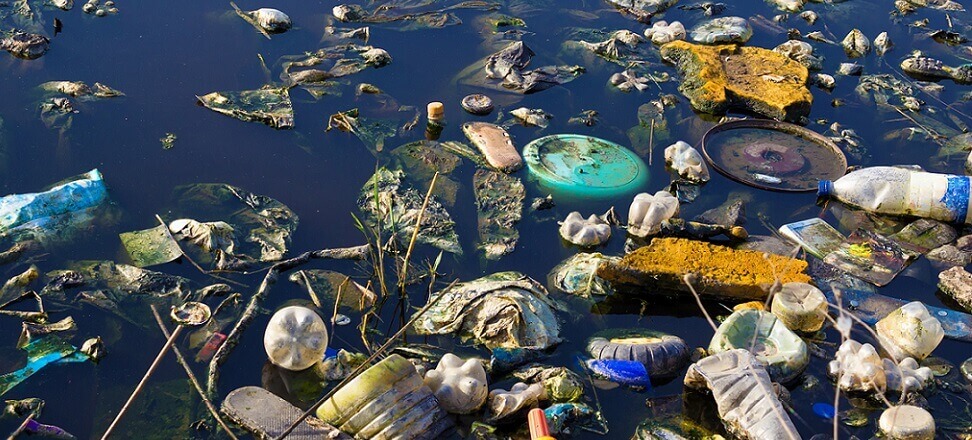
The Helsinki Commission recently published maps assessing the state of the Baltic Sea. One indicator is the amount of trash on beaches. Interestingly, it turns out that among the least littered bodies of water is the Gulf of Gdansk. This is surprising, since the Vistula River flows into it, and rivers are considered an important source of marine debris.
Garbage in rivers around the world – results of different analytical approaches
The role of rivers as a transporter of trash is cited in many discussions, although it is sometimes estimated differently. Extreme examples include phrases like “only five rivers matter in the world.” The infamous title of record holder is attributed to the Yangtze River. Discussions have this in that while they are based on certain data, they can distort, hyperbolize or bend it for rhetorical purposes. As a rule, however, there is at least a grain of truth in them. Litter in rivers is a problem largely affecting developing countries.
In fact, the Yangtze is mentioned first in the work Lebreton et al. z 2017 r. The team estimated the influx of plastics at an average of 333,000. t/yr. In second place is the Ganges, slightly exceeding 100,000. t/yr. Further afield, with inflows of tens of thousands of tons per year, are also rivers from the region, as well as from West Africa and South America. As a rule, these are very large watercourses, including the Amazon. The table included in this publication compares 20 facilities.
In another paper from the same year(Schmidt et al.), it was also the Yangtze that was singled out as the record holder. In second place, however, was not the Ganges, but the Indus. The table includes 10 rivers. The Amazon didn’t fit in, instead there is the Nile. Yangtze in the first place agrees, but already the amount of plastic carried is estimated at 69,000. t per year of the macro fraction and from 85,000. Up to 1.5 million tons of micro fractions. This discrepancy in microplastic loading is due to differences in the models adopted.
The above comparison shows that the assumptions of the adopted model can significantly affect the results. Both papers emphasize that the problem of plastic pollution in the oceans is mainly in Southeast Asia. The source of the overwhelming majority of plastic (67%, or perhaps even 90%), according to various researchers, is either a few major rivers or a group of dozens of watercourses, sometimes smaller, but highly polluted downstream. These two publications were followed by the 2021 issue of another. Among the authors were both Lebreton and Schmidt, but Meijer is the leading name, and previous models have been criticized as highly simplified.
In the latest approach, for example, the focus on very large rivers was considered an oversimplification. Thus, as many as 100,887 watercourses flowing into the seas and oceans were analyzed. Combined estuaries in the form of a common estuary or lagoon were also considered. Previous models took into account population density and hydrology, including the presence of dams. The new model was based on more accurate data, including meteorological data. There has also been a new calibration of this data in rivers with known plastic trash loads. The analysis included macroplastic, taking into account that the longer and hydromorphologically richer the river, the more it will break down into smaller pieces, passing into the micro fraction.
If only one had glanced at a map showing the amount of trash in the rivers, the first impression might have remained the same. The huge problem is in Southeast Asia, but the Amazon and the Gulf of Guinea are also experiencing it. Most plastic trash (defined as something thrown away, as opposed to recycled, mismanaged plastic waste) is generated in China and India. However, the more accurate results of the analysis are revolutionary. Where does the Yangtze rank in ocean litter? On the sixty-fourth. Although a great deal of garbage is generated in its basin, much of it stays on land and in the river without reaching the sea. Only 0.58% of that mass goes there. In the case of India, it is 0.97%, which, however, in absolute numbers, gives a larger mass.
Even more garbage flows from the Philippines, where the ratio reaches 8.85%. In countries such as Brunei, Martinique, Panama and North Korea, the share is even more significant, but as the overall garbage production is quite low, the actual mass of garbage in the rivers does not change the overall ranking. Thus, the country that supplies the most macroplastics to the sea is the Philippines. The rivers there are not record long, so they don’t retain trash. Most trash is carried by the Pasig, a river that flows through Manila.
According to the latest analysis, these are 63,000. tone. In second place is Tullahan, also collecting garbage from the Manila metropolitan area, although its contribution is three times lower. It is hardly inferior to Mumbai’s Ulhas and the Klang, which flows through Kuala Lumpur. The next three rivers also represent the Philippines and are only followed by the Ganges. Next up is a series of five more Philippine rivers, two little-known ones from Vietnam and Thailand, and the first watercourse from outside the region – the mouth of the Lagos lagoon. It is three places above China’s highest-ranked river – the Huangpu, which flows through Shanghai. There are more rivers from the region in the top 50, from Sri Lanka to the Philippines, as well as isolated cases from Africa and Latin America (but not the Amazon, Nile and Congo).
No European river appeared in the list of the 50 most trashy rivers. The countries of the Old Continent (not counting Turkey) do not contribute much to this modeling. Even the United States (33rd place) is worse than Albania (closing in on the fourth ten) in this regard. Poland is in the second hundred, between Australia and Martinique. The place of the countries in our region is determined not only by the relatively low amount of plastics becoming trash, but also by the rather low percentage of this amount that did not stop on land and inland. In the case of Poland, it is 0.21%.
Land use and climate are important in this part of the model. As a result, European river basins, even if they produce a mass of unrecycled plastic greater than some basins in the intertropical zone, contribute less with marine litter. In addition to Albania, mention can be made of the UK, Russia and Ukraine (pre-war data), where the presence of garbage in rivers is noticeable.
Garbage in mountain rivers on the example of the Carpathians
In 2023. Two papers on trash in the rivers of the Carpathian region have been published, with Maciej Liro as correspondent author. One of them is based on modeling of macroplastic transport through rivers. Here the seas – the Baltic and Black – are the ultimate recipients, but the models apply to the mountain region. It’s not just high altitude, as the Carpathian Mountains also have lower sections in the Czech Republic, Hungary and Serbia. In addition, Carpathian rivers often flow in quite deep valleys, for example – the Dunajec Gorge under the Pieniny Mountains is roughly 400 – 500 meters above sea level.
The model delineates hotspots, i.e. places with particularly high production of plastic trash (above 409.7 t/yr/km2) and coldspots with production of less than 1 t/yr/km2.Geographic considerations mean that most hotspots and coldspots (about half) were located in Romania. The case is different when the length of the river sections located in a hotspot or coldspot is divided by the length of the rivers in the country. Then the Serbian Carpathian rivers turn out to be the least littered – there is no hotspot there, and almost 100% of the watercourses are in coldspots. Less than 1% of hotspot sections are in Poland and Slovakia, and just over 1% in the Czech Republic. For that, as many as1/3 of Hungarian episodes fall into the hotspot category.
In Romania it is 6.9%, and in Ukraine 12.4%. In addition, only 18.2% of Hungarian episodes are in coldspots. It is the only country in the study area where the normalized share of hotspots is greater than coldspots. In the Polish Carpathians, the share of coldspot sections is1/4, while in the Ukrainian and Slovak Carpathians it is about half. Thus, Carpathian rivers can be considered extremely low litter in Serbia, very low litter in Slovakia, low litter in Poland and rather low litter in Hungary. Ukraine and Romania are patchwork in this regard. The authors here cite data on the percentage of plastic recycled in each country. And in terms of marine catchments, more of both coldspots and hotspots are in the Black Sea basin than in the Baltic Sea. Ultimately, however, it is the hotspots that are more noticeable, and here the influence of the Danube River basin is key.
What these various papers have in common is that they are essentially projections of models, not the result of actual measurements (this, by the way, is a feature of a great many modern scientific papers). They are better or worse calibrated with actual data and better or worse selected parameters. In such contexts, the Pareto rule is sometimes invoked, according to which 20% of the sources are responsible for 80% of the effect (and vice versa). If one were to focus on this 80% plastic in the ocean, according to the work of Lebreton et al. 47 rivers are responsible for it, while Schmidt et al. 5 only. Meanwhile, in the work of Meijer et al. is 1656. That’s quite a spread that leaves room for further research. Garbage in rivers is still a topical issue, and one that affects not only the country through which a river flows, but also the sea or ocean – a common good.
More on this topic in a previous article: About what doesn’t live in water.