Polski
The urban man, a socially educated individual adapted to urban life, uses water for everything, but at the same time believes that he does so in a conscious, economical and ecologically correct way. He brushes his teeth with the tap turned off, washes dishes in a water-efficient dishwasher, washes in an A+-class washing machine (and more, because, as the manufacturer wrote, energy efficiency goes hand in hand with water efficiency), and bathes in the tub only on Sundays, showering on the other days. It probably can’t be more economical.
Water demand – water footprint
When we go to the store and buy any product, we must be aware that a certain amount of water was used in its production, resulting from the demands of the technological process. Whether it’s a loaf of bread, a kilo of tomatoes or a jar of mustard, each of these things requires water. Even the production of relatively dried products, such as dried fruits or mushrooms, begins with washing them.
For each of the products, we can determine the so-called. water footprint, which determines the sum of the water we use directly, that is, when water is used on a daily basis for drinking, washing, laundry, cooking or watering the garden, and indirectly, that is, when water is used during the production process. For example, one egg (60 g) has a water footprint of more than 190 liters of water, a kilogram of tomatoes more than 200 liters, and a kilogram of beef as much as 15,000 liters. The more lengthy and complicated the production process, the larger the water footprint of the final product.
Demand vs. consumption
Every household is different, and therefore has different water needs. It largely depends on the number of household members and their habits, the number of water-consuming appliances, and the frequency of their use.
Average water consumption is normalized in the Decree of the Minister of Infrastructure of January 14, 2002. On determining average standards for water consumption. The provisions of the regulation have a practical dimension and allow the adoption of certain statistical values for the design of water supply facilities and for forecasting the necessary capacity of intakes. Since there are no legislative standards specifying water requirements for specific economic fields, it was assumed that the water ordinance. of water consumption will be a measure of determining the reference conditions of the projected water demand of the various fields of the economy. The regulation set consumption standards for several groups of consumers:
- households;
- Watering home gardens and agricultural crops;
- services;
- farms and livestock facilities;
- Operation of motor vehicles, agricultural machinery and workshops;
- agri-food processing plants;
- construction works;
- chemical crop protection;
- Military facilities of the defense and interior ministries.
The ordinance specifies in great detail the norms of water consumption/demand specifying, among other things. average per capita consumption in households, which were indicated in as many as five ranges:
- Water supply without toilets and bathrooms (no sewage system), water intake from a yard or street spring – 30 liters/inhabitant/day;
- Water supply, toilet without bathroom – 50-60 liters/resident/day;
- Water supply, kitchen sink, toilet, no bathroom and hot water – 70-90 liters/resident/day;
- Water supply, toilet, bathroom, local source of hot water (boiler, coal stove, electric stove, gas stove with cylinder gas) – 80-100 liters/resident/day;
- Water supply, toilet, bathroom, hot water supply to the apartment (from the CHP, district or block boiler house) – 140-160 liters/resident/day.
Is it a lot or is it a little? And this is where the statistics office comes out ahead. An institution that analyzes everything and from every angle. It conducts research on indicators that we think are unnecessary and unused. However, it must be admitted that what may seem absurd at first, sometimes comes in handy. Examples include indicators in the environmental quality of life of the population, which the CSO includes. The percentage of the population using the water supply system. Based on this data, we conducted an analysis of average urban and rural water consumption.
For the calculations, we took the product of the rate of access to mains water in urban and rural areas and the average water consumption specified by the ordinance – 140 liters per day for water supply (toilet, bathroom, hot water supply to the apartment) for urban residents and 80-100 liters per day for rural residents. According to CSO data, in 2002. The water supply system was used by 94.2% of the urban population and only 69.7% of the rural population. In 2021. The ratio stood at 96.7% and 85.9%, respectively. We present the calculations in the chart below.
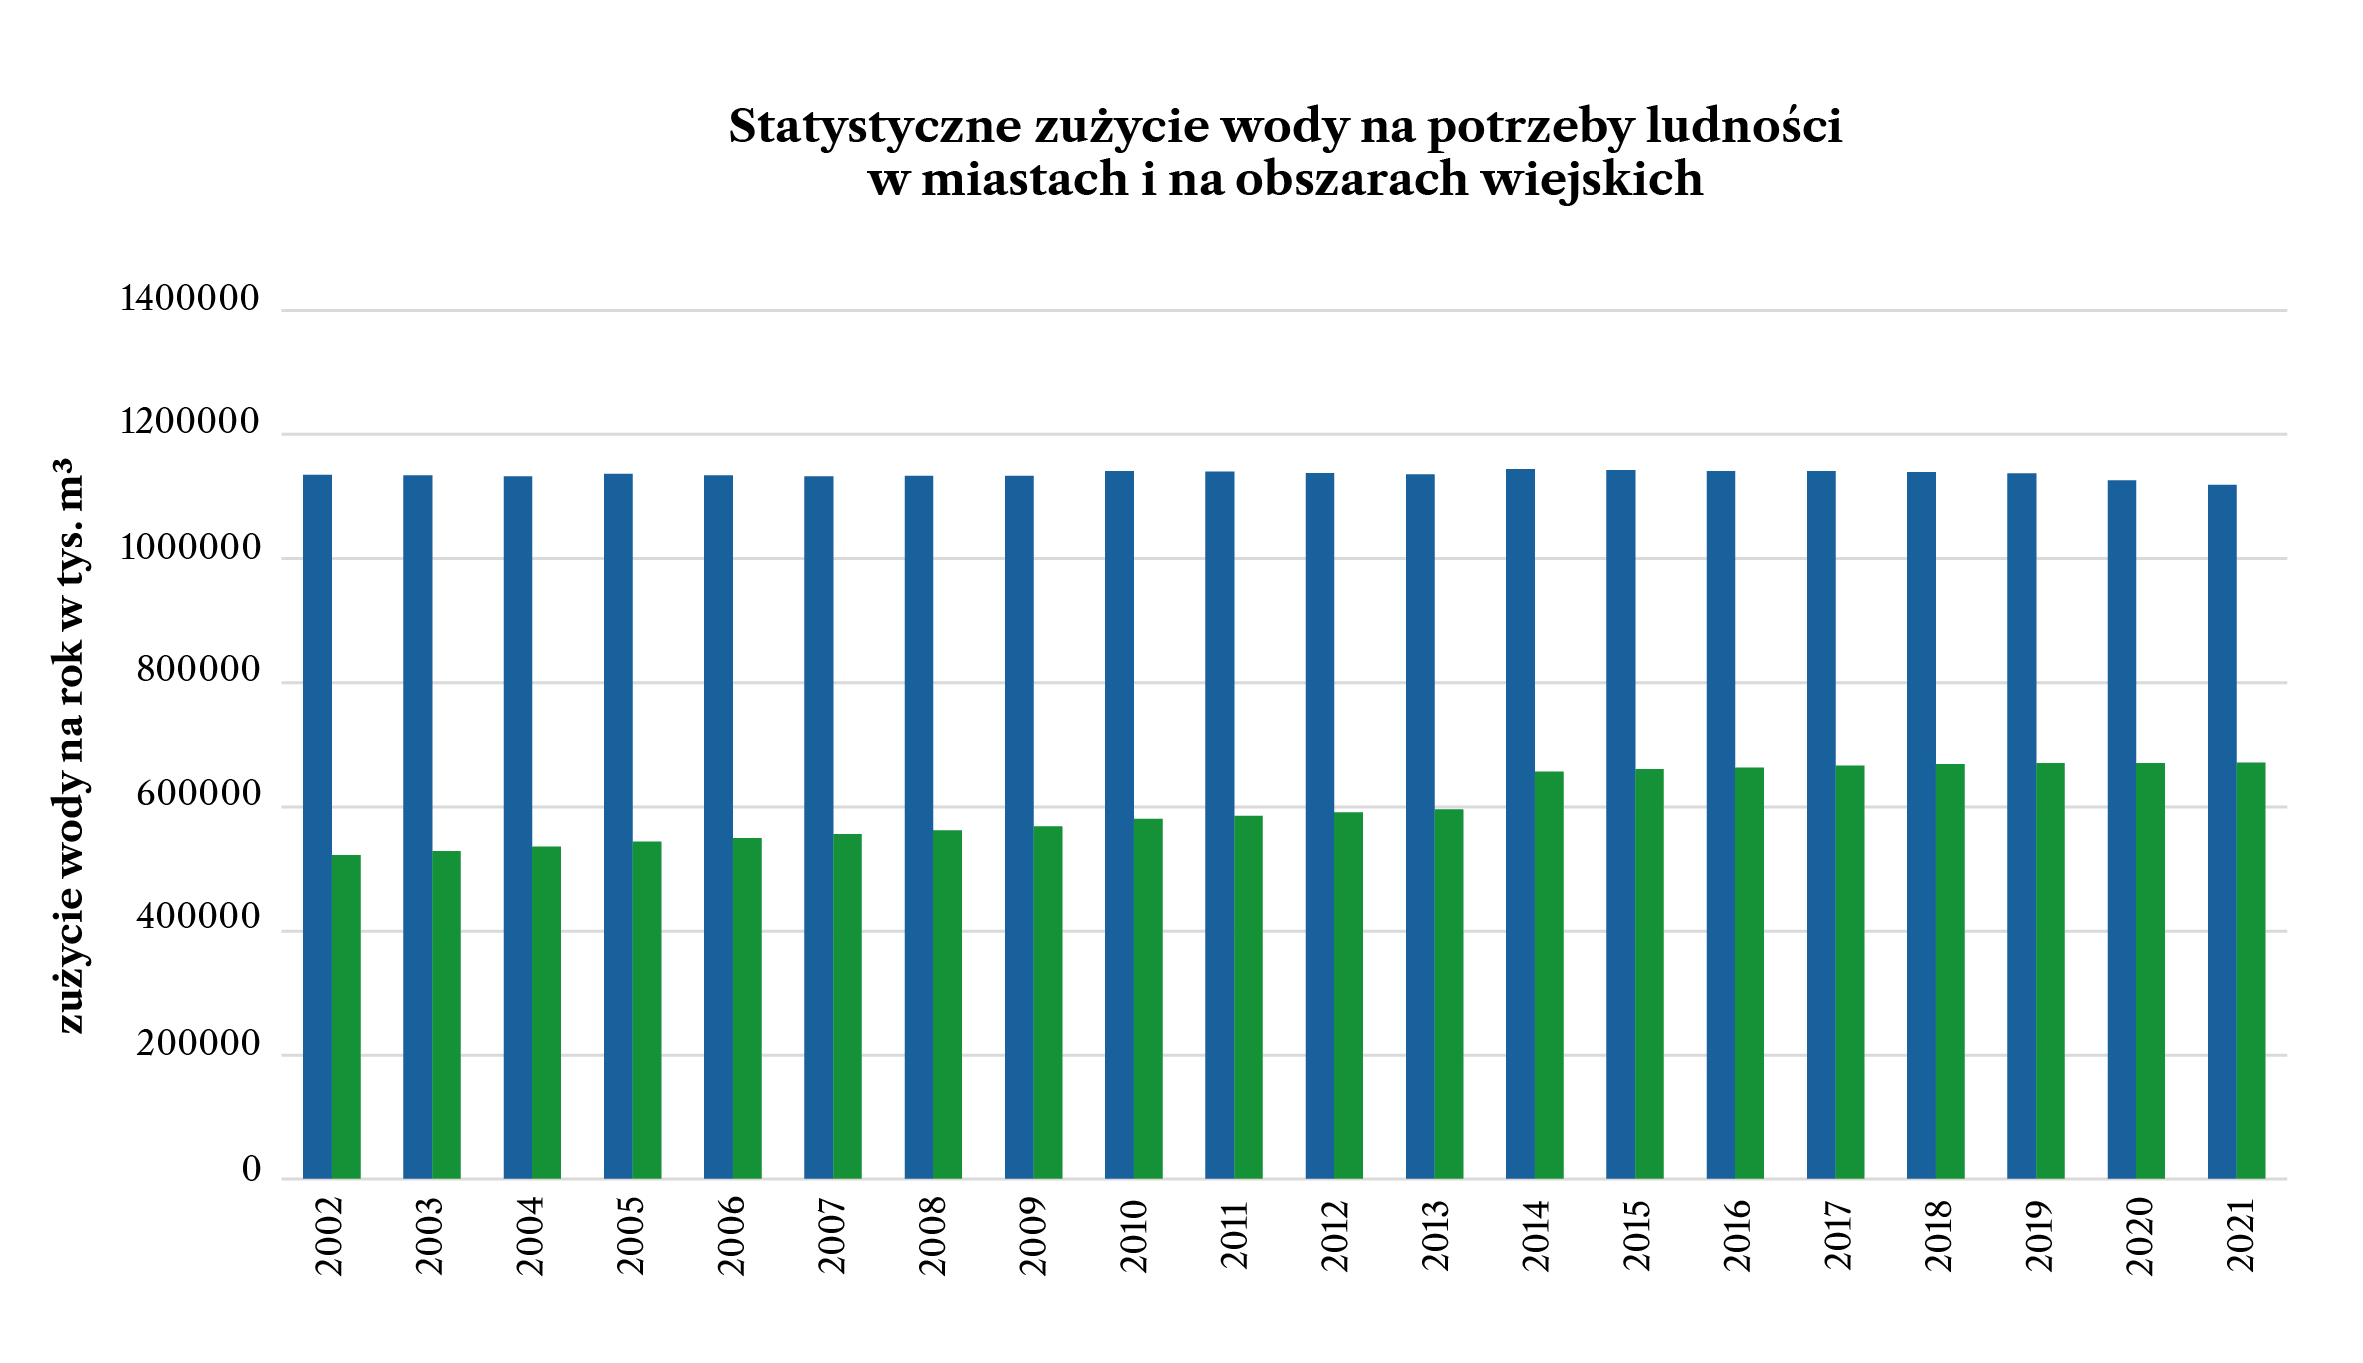
Access to mains water, once a luxury and a source of envy among neighbors, is now one of the basic human needs that significantly affects health and standard of living.
From 2002 to 2021, an increase in water consumption and an increase in the number of residents using water supply infrastructure in rural areas could be observed. At the same time, values for urban residents remain stable. Nevertheless, looking at the chart, one conclusion comes to mind – more than twice as much water is used in cities than in rural areas.
The indicators developed by the CSO are intended to support efforts to improve the efficiency of the use of elements of the natural environment. They should also provide information for decision-making in the environmental area. Therefore, it is left up to you, dear readers, to decide whether it is better to live “frugally” in the city or less luxuriously in the countryside.
Water consumption/demand standards have been set for almost all areas of life. The FAO (Food and Agriculture Organization of the United Nations) has specified, among other things. standards for water requirements during the growing season of selected crops [FAO 2012]. For example, cabbage shows a demand of 350 – 500 mm/vegetation season, as does onion, while sugar beet already needs 550 – 750 mm/vegetation season.
Best Available Techniques (BAT) guidelines for the brewing industry, developed in 2005. by the Association of Employers of the Brewing Industry in Poland “Polish Breweries”, give values for the demand for water from 3.1 – 10 dm3/dm3 of beer produced, while indicating that in large, modern breweries the most common consumption level is in the order of 4 – 6 dm3.
Best Available Techniques (BAT), developed for most industries, state the water requirements of the production process. They also point out the directions of measures aimed at saving it, i.e. using closed circuits, washing semi-finished products and packaging in closed circuits, optimizing consumption and adjusting water intake to actual needs.
Are we saving or not?
For several years there has been a downward trend in per capita water consumption for the national economy and population. While not a very clear and spectacular decline, it is noticeable. CSO data showing water consumption is illustrated in the chart below.
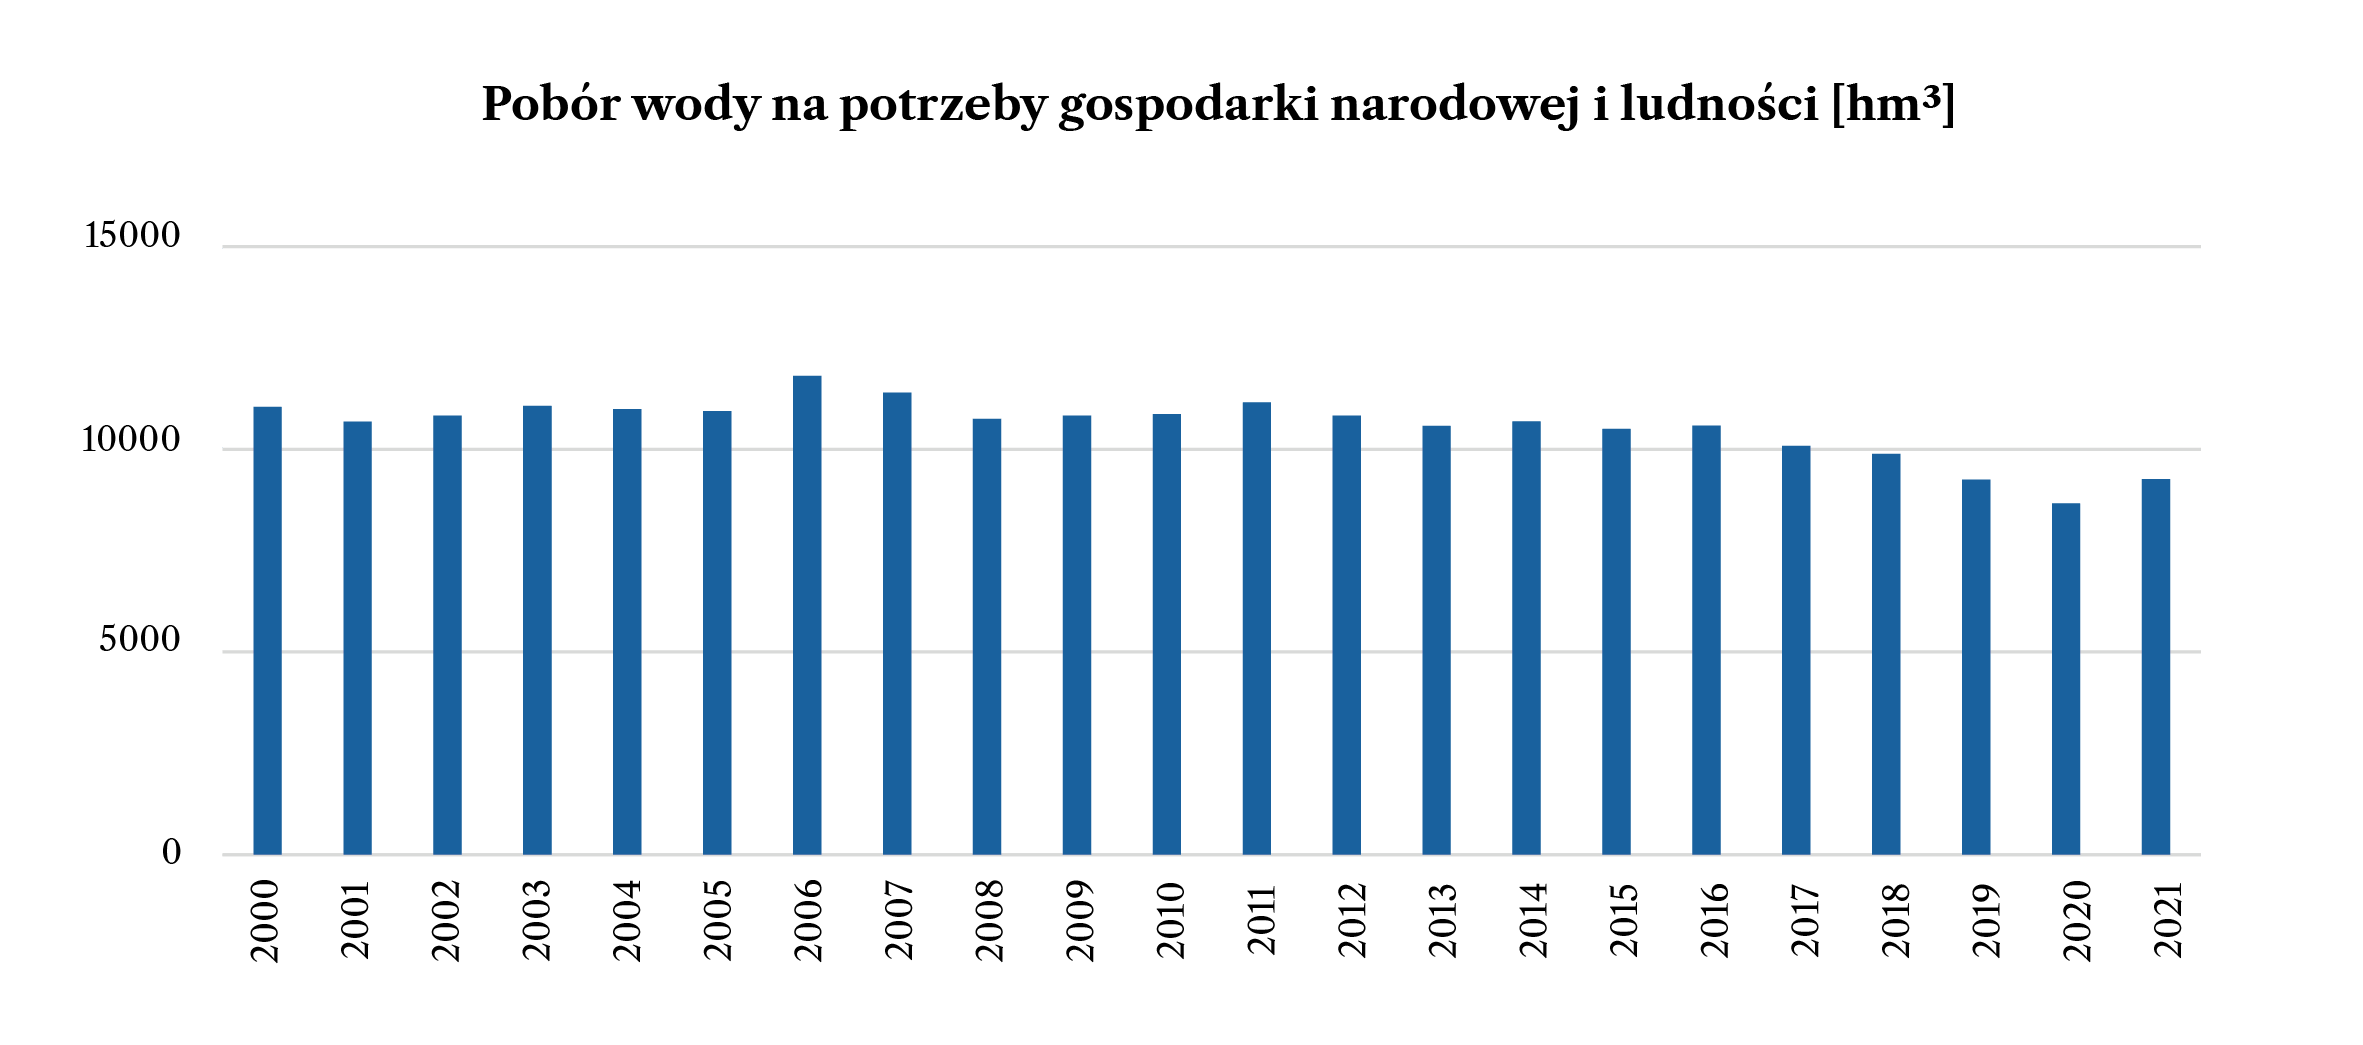
The decreasing trend over the years indicates that the national economy is implementing water-saving processes, including BAT, and the general population is guided by the principle of saving water consumption. Note, however, that when approaching the problem of saving water individually, it is worth adopting a purely mathematical principle:
consumption > demand ≠ saving
consumption < demand = saving